How to Analyze Your Interactive Brokers Trading Performance
Turn Interactive Brokers exports into a useful performance review by reading net P&L, trading costs, win rate, profit factor, equity, and symbol results together.
14-day free trial. No credit card required. Then $89 per year or $9 per month.

Performance analysis starts with better questions
An Interactive Brokers statement documents account activity in detail. Performance analysis has a different purpose: it organizes that history so you can compare periods, investigate outliers, and understand which parts of your trading process deserve attention.
No single statistic can tell you whether a strategy is sound. A high win rate can hide oversized losses, while a profitable month can hide excessive costs or dependence on one unusually large trade. Useful analysis connects several metrics and then returns to the underlying trades.
The IBKR performance metrics worth reviewing
Read these measures together and compare equivalent date ranges whenever possible.
| Metric | What it measures | Question to ask |
|---|---|---|
| Net P&L | Realized result after included commissions and fees | Did gross gains remain meaningful after costs? |
| Win rate | Percentage of closed trades that were profitable | Are winners large enough to support this win rate? |
| Average winner | Average net gain among winning trades | Are profitable trades being exited too early? |
| Average loser | Average net loss among losing trades | Are a few losses dominating the period? |
| Profit factor | Gross gains divided by the absolute value of gross losses | Does the result persist across enough trades and periods? |
| Equity curve | How cumulative realized results change over time | Where do drawdowns or changes in consistency begin? |
| Symbol P&L | Net results grouped by ticker | Which symbols help or hurt the overall result? |
Begin with net P&L, not gross P&L
Trading costs can turn an apparently productive period into a marginal one. Start by comparing gross results with commissions, regulatory fees, and final net P&L.
Cost ratio
Compare total costs with gross gains and trading volume.
Trade frequency
Check whether more activity actually produced a better net result.
A rising cost total is not automatically a problem. It becomes useful evidence when you relate it to trade count, position size, gross gains, and the strategy being traded.
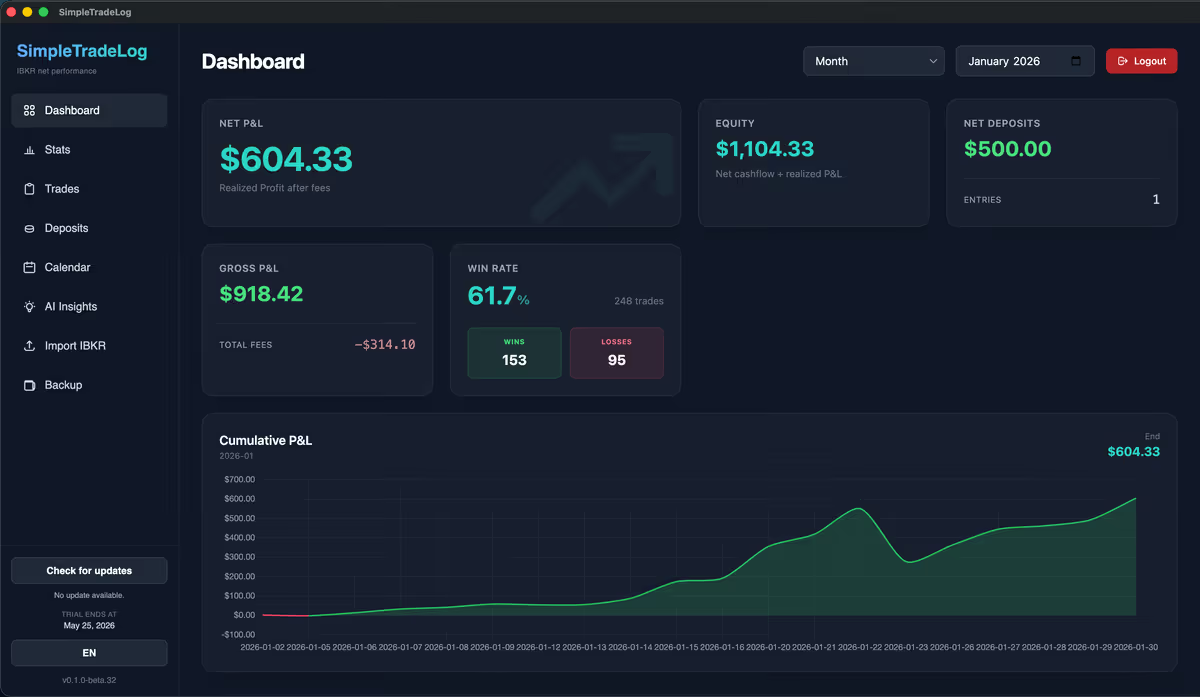
Analyze from the broad result to individual trades
A consistent order keeps the review focused and reduces the temptation to explain the whole period with one memorable trade.
- 1
Set one date range
Review a day, week, month, or quarter and keep the comparison period equivalent.
- 2
Read the headline result
Check net P&L, costs, trade count, win rate, average outcomes, and profit factor.
- 3
Find concentration
Identify the days and symbols responsible for most gains, losses, and costs.
- 4
Inspect the trades
Return to the executions behind each outlier before drawing a conclusion.

Compare periods without fooling yourself
Weekly and monthly comparisons are most useful when the strategy, market, and activity level are reasonably similar.
- Compare equal-length periods rather than a full month with a few trading days.
- Check trade count and position sizing before attributing a change to skill.
- Separate a broad pattern from one exceptional winner or loser.
- Use several periods before treating a result as persistent.
The goal is not to force every week to look alike. It is to distinguish normal variation from a process change worth investigating.
Review by symbol
Rank tickers by net P&L, trade count, and total costs. Then check whether the strongest result depends on one trade and whether repeated losses share a recognizable pattern.
Review outlier days
Inspect the best day, worst day, and most active day. These often reveal position-size changes, overtrading, or a market event that headline averages hide.
Write one conclusion
End each review with one observation and one action to test. Several simultaneous rule changes make the next period harder to interpret.
Move from IBKR exports to focused analysis
SimpleTradeLog imports Interactive Brokers .tlg trade logs and activity statement .csv files. It organizes closed trades into dashboard, calendar, trades, and statistics views so you can review net results, costs, periods, and symbols.
Imported trades and cashflows stay on your computer. Account, license, and billing checks are online. SimpleTradeLog supplements your broker records; IBKR statements remain the authoritative account documents.

Continue your Interactive Brokers review
Build an IBKR trade journal workflow, learn how to export an Interactive Brokers activity statement and import Interactive Brokers statements, compare the best trading journals for Interactive Brokers, or explore an offline trading journal. See SimpleTradeLog pricing when you are ready to try the desktop workflow.
Frequently asked questions
Practical questions about analyzing Interactive Brokers trading performance.
How do I analyze my Interactive Brokers trading performance?
Export the IBKR period you want to study, include commissions and fees, and review net P&L alongside win rate, average winner and loser, profit factor, equity, days, and symbol results. Then inspect the individual trades behind important outliers.
Which trading performance metric matters most?
No single metric is enough. Net P&L shows the final realized result, while win rate, average outcomes, profit factor, costs, and the equity curve help explain how that result was produced.
Should I analyze gross or net P&L?
Use both, but make decisions with net P&L in view. The difference between gross and net results shows how much commissions and applicable fees affected the period.
How often should I review my IBKR performance?
A brief weekly review and a broader monthly review work well for many active traders. The useful schedule is one you can repeat consistently without making decisions from an unrepresentative sample.
Analyze your IBKR history with less setup
Import Interactive Brokers trades, include trading costs, and review performance by period, day, and symbol in a focused desktop journal.