IBKR trade journal for better trading reviews
Learn how to turn Interactive Brokers exports into a consistent review process: measure net performance, identify repeatable strengths, and find the habits that cost you money.
Why keep a journal when IBKR already has reports?
Interactive Brokers provides detailed statements and reporting. Those records are valuable, but they are primarily designed to document account activity, not to support a repeatable post-trade review.
A trade journal gives that raw data context. It helps you compare periods, isolate symbols, understand costs, and ask whether your process is improving rather than judging yourself by one good or bad day.
Questions an IBKR journal should answer
A long list of metrics is not automatically useful. Start with questions that can change your next trading decision.
What did I actually keep?
Compare gross P&L with commissions, regulatory fees, and final net P&L.
Which symbols suit me?
Find where your gains come from and which tickers repeatedly produce losses.
Is my edge consistent?
Review weekly and monthly results instead of relying on recent memory.
Are winners larger than losers?
Track average winner, average loser, win rate, and profit factor together.
When do costs become excessive?
Spot overtrading when fees consume too much of otherwise profitable activity.
Is the account progressing?
Use an equity curve and period comparisons to see the wider trend.
From Interactive Brokers export to review
The workflow should be simple enough to repeat after every session or at the end of each week.
- 1Export the right periodGenerate an IBKR activity statement CSV or trade log for the dates you want to review.
- 2Import and validateConfirm that executions, commissions, fees, and realized results were recognized as expected.
- 3Review from broad to specificStart with the period result, then inspect days, symbols, and individual trades that stand out.
- 4Write one actionable conclusionChoose a behavior to repeat or avoid in the next session. Review works best when it changes an action.
How to read the important metrics
Metrics are clues, not grades. Read them together and compare like-for-like periods.
| Metric | What it tells you | What to investigate |
|---|---|---|
| Net P&L | The result after trading costs | Whether gross gains survive fees and commissions |
| Win rate | How often trades close profitably | Whether it is supported by adequate winner size |
| Average winner / loser | The payoff balance between gains and losses | Early exits, oversized losses, and stop discipline |
| Profit factor | Gross profit relative to gross loss | Whether a strategy remains positive across enough trades |
| Symbol P&L | Results grouped by ticker | Concentration, familiarity, and recurring weak spots |
| Equity curve | How results accumulate over time | Drawdowns, volatility, and changes in consistency |
A simple weekly review routine
- Check net P&L and total costs.
- Compare the current week with the previous four.
- Review the best and worst day without skipping either.
- Inspect the strongest and weakest symbols.
- Choose one process adjustment for next week.
Avoid changing several rules at once. A journal becomes more useful when each review leads to one testable adjustment.
Journal or spreadsheet?
Spreadsheets remain flexible and can work well for traders who enjoy building their own system. The trade-off is ongoing import work, formula maintenance, formatting, and the possibility of silent calculation errors.
A dedicated journal is most useful when automation makes you more consistent. The best tool is the one you can maintain without avoiding the review itself.
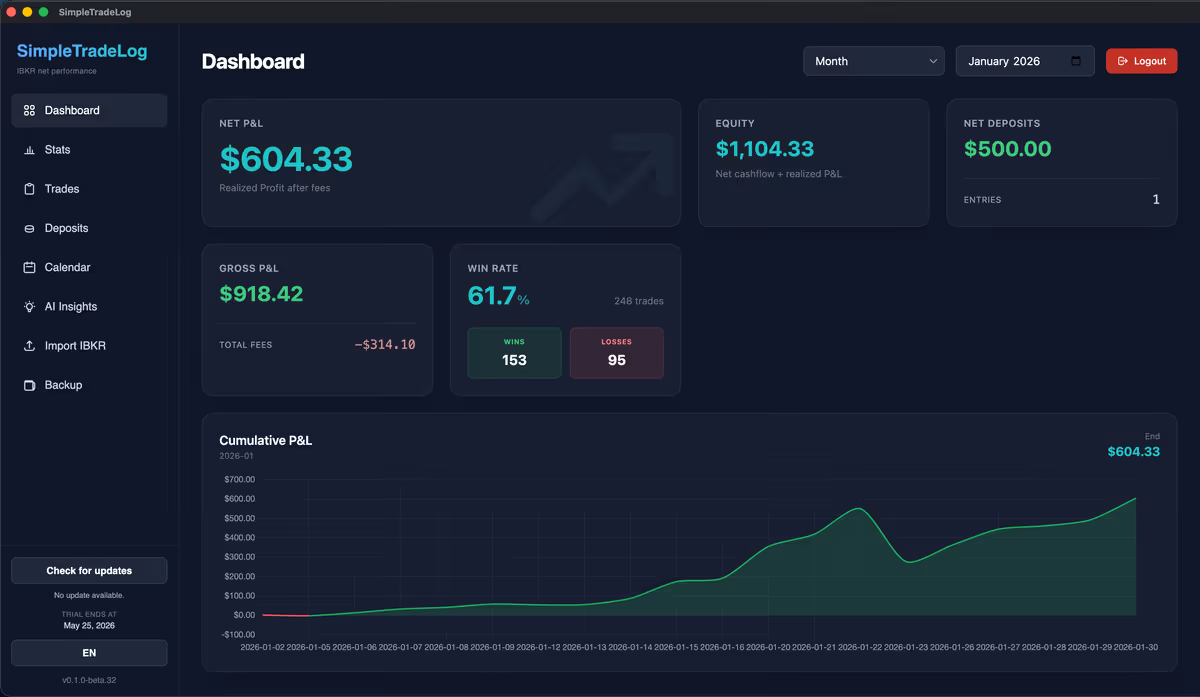
A desktop journal focused on the IBKR review loop
SimpleTradeLog manually imports supported Interactive Brokers stock trades from .tlg trade logs and activity statement .csv files, calculates net results after costs, and provides dashboards, calendar views, statistics, symbol analysis, and local backups.
Imported trades and cashflows stay on your computer. Account, license, billing, and anonymous product analytics use online services.
14-day free trial, then $89 per year or $9 per month per machine.

Compare journal approaches
Start with the Interactive Brokers trading journal guide, learn how to analyze Interactive Brokers trading performance, follow the Interactive Brokers statement import guide, open an IBKR .tlg file or an offline trading journal, compare the best trading journal for Interactive Brokers guide, learn when to move beyond a trading journal spreadsheet, or see pricing.
Common questions
A few practical considerations when setting up an Interactive Brokers journal.
What is a good trading journal for Interactive Brokers?
One that reliably imports your trades, includes costs, shows performance over time, and is simple enough to use after every session.
Does SimpleTradeLog support IBKR statements?
Yes, for stock trades in .tlg trade logs and activity statement .csv files.
Does it calculate commissions and fees?
Yes. Applicable costs are included so you can review net rather than only gross performance.
Can it replace an IBKR spreadsheet?
For supported IBKR stock trades, manual file imports replace trade-by-trade entry and formulas for common calculations and summaries.
Build a review habit you can maintain
Import your Interactive Brokers trades, measure the real result, and turn each review into one better decision.